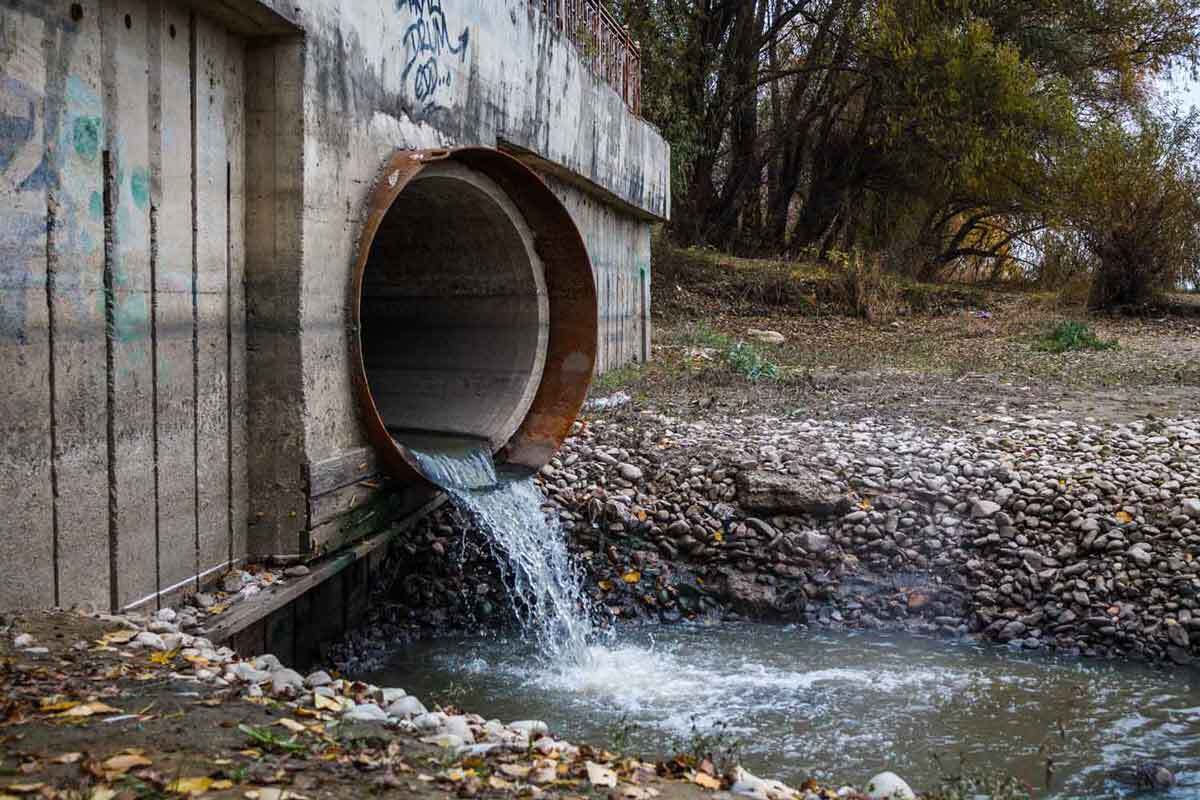
The customer is a block of flats in the residential area of Boyana, Sofia. The challenge that the facility manager wanted to address was the increasing water bills in the last 3 months without obvious reason.
ThingsLog solution
So we have proposed ThingsLog Remote water meter reading and monitoring solution.
Our logger is attached to a water meter generating one pulse per cubic meter of water so each dot on the graph is 1m3 of water.
The system immediately detected a couple of cubical meters that were consumed each day in the morning between 5 and 8 am.
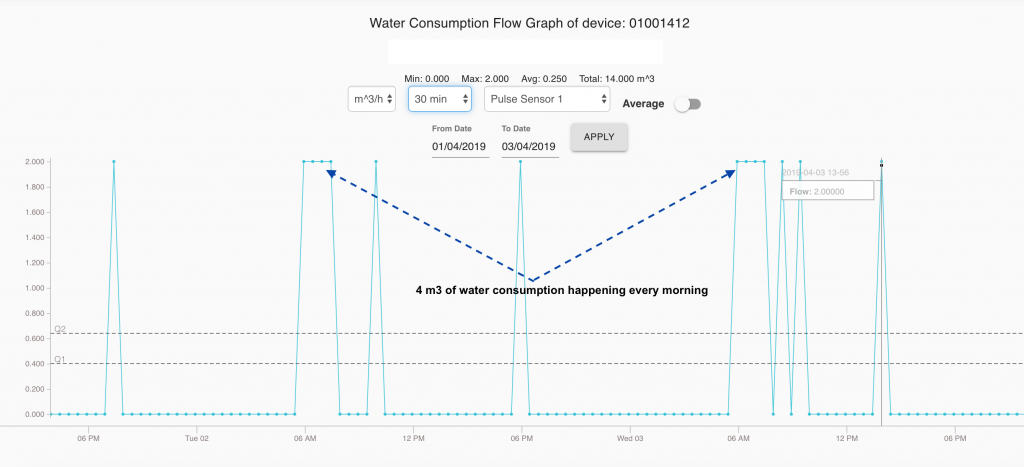
The graph above shows that on the 1th of April there was no issue but on 2th and 3th 4m3 of water have been consumed. The system immediately signaled the high consumption.
The customer found that the irrigation system was switched on. And in April the weather in Bulgaria is quite rainy so it is a complete waste of water to have irrigation working.
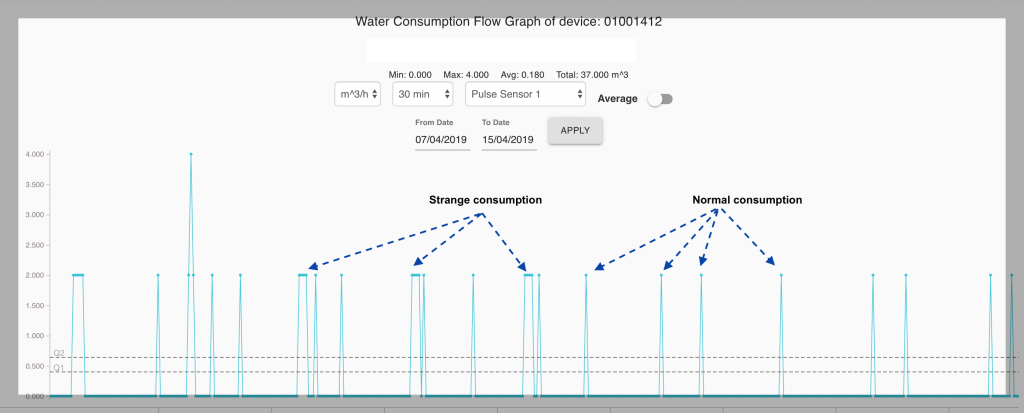
The customer further found an issue with the moisture sensor. It was not supposed to trigger the system in such conditions but it did. Replacing the sensor fixed the issue, which was immediately visible on a graph showing normal consumption.
Here you can see the effect on average from switching off the irrigation system.
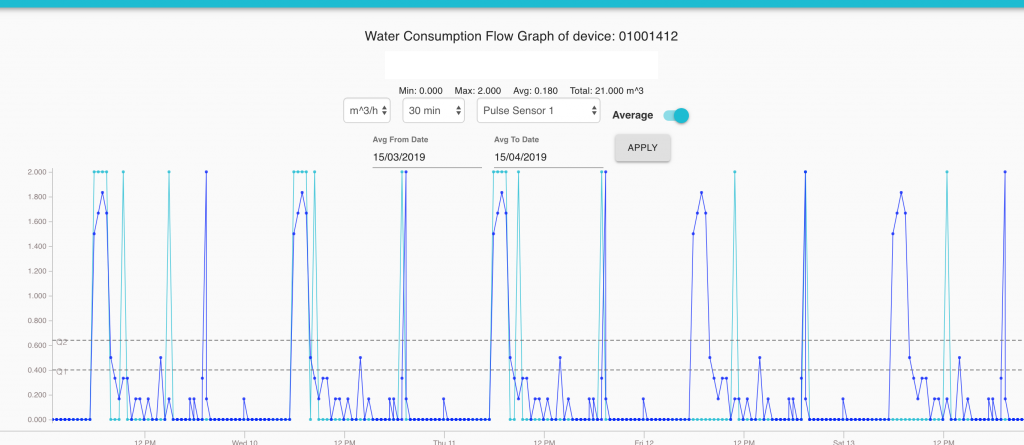
On the left you see how does the average (dark blue) fits well with the pattern of irrigating and on the right you see how the consumption declined and now is way under the average.
Benefits for the customer
The result? For just 10 days ThingsLog water monitoring system saved the customer about 4×10=40 m3 of water, which amounts to around 100 bgn and it is pretty close to the total cost of ThingsLog service per year.